About me
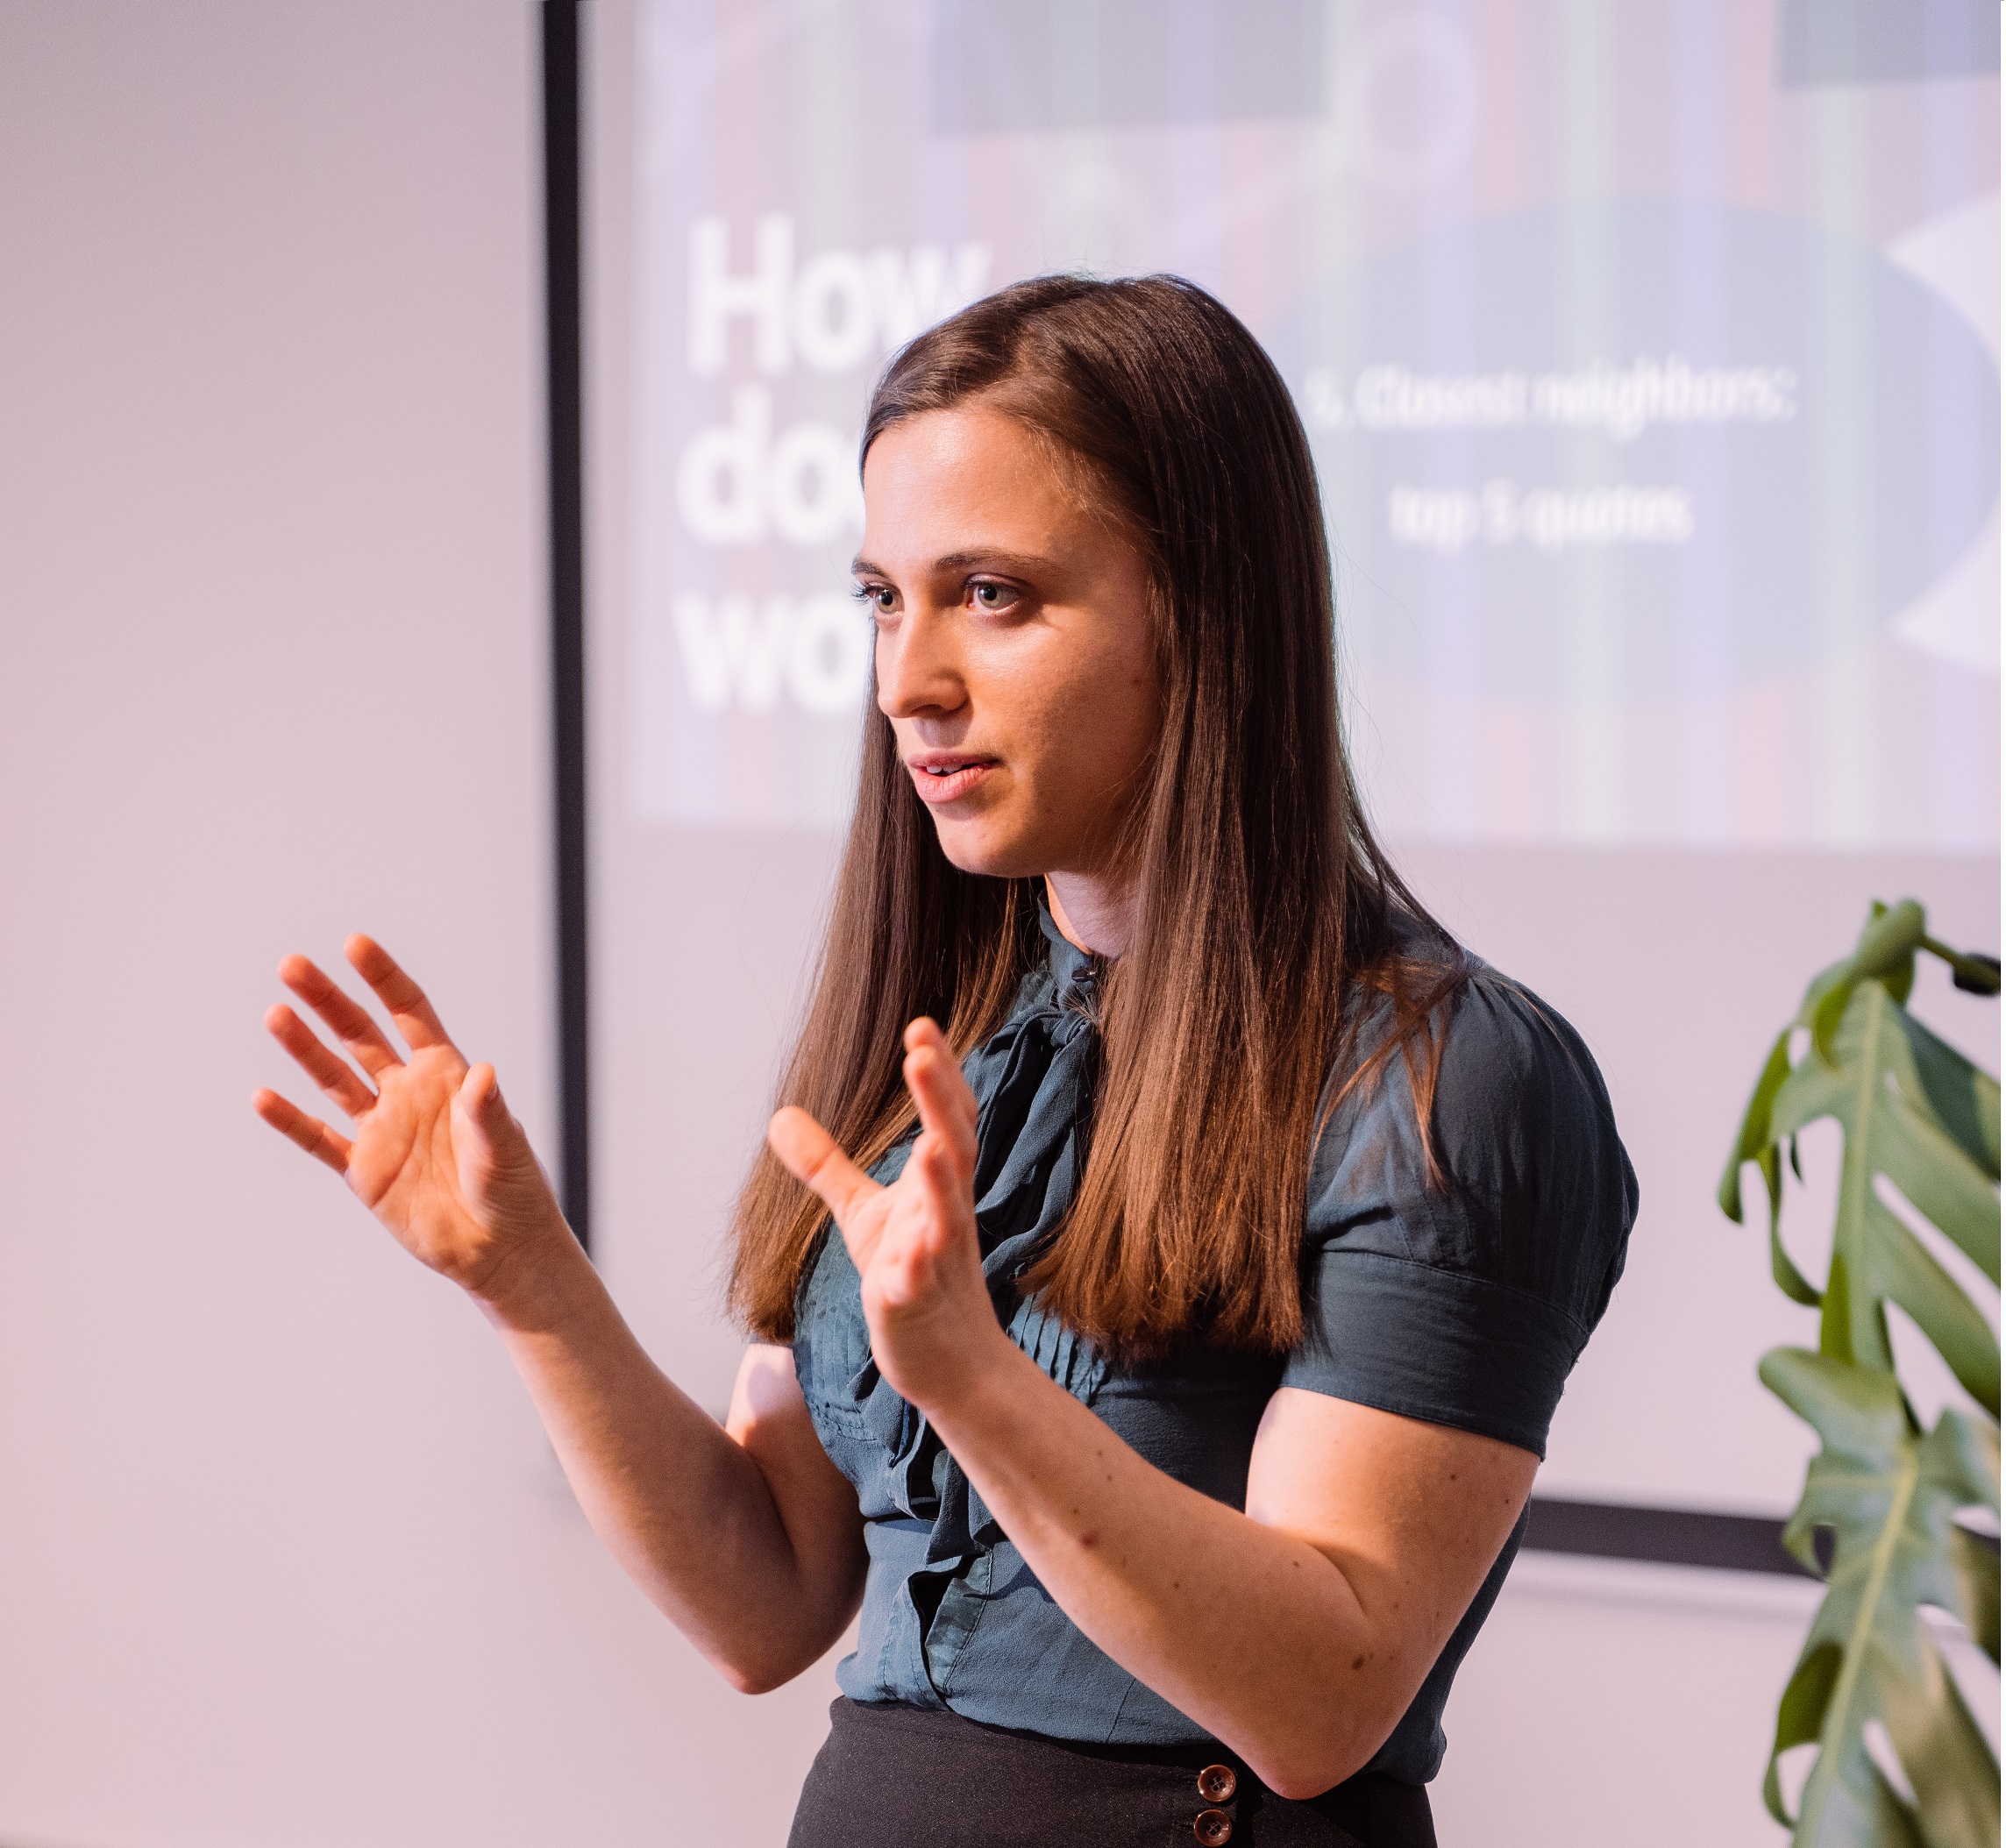
I am an experienced Data Scientist with more than 5 years experience of working in Finance and Innovation. After having experienced working on big datasets mainly with Excel in my financial roles, I wanted to learn more about efficient solutions to handle these kind of data, which is why I decided to further educate myself and participate in an intense Data Science Bootcamp.
In my previous roles in Finance, I often felt underchallenged, so I started to look into Data Science courses/programmes/anything that would enrich my knowledge. After having completed multiple self-analyses, I knew myself enough to know that I need a vibrant, active environment to thrive in whatever I am doing. So that is what I am still looking for right now and also that is why I have chosen to complete an intense bootcamp to collect as much knowledge and ideas as possible like a sponge. I learned throughout the years that I feel the most fulfilled when I am challenged to find the most appropriate solution to a certain problem. Being a Data Scientist in Condé Nast´s Innovation Team has proven me that this profession gives my the exact fulfillment I need. By the way, check out a selection of my favorite projects.
Here you can find my work experience and education which contain all the important professional facts about me, but what you cannot find is that I am a great team-worker, I am percise and whatever tasks I get assigned to, I always keep the deadlines and execute them responsibly. I am a passionate person who uses her passion to help others and participate in social projects. I am organised which I had to learn while moving around the world, taking care of all the organisational things while already working full-time.
I am looking forward to hearing from you and I would be very glad if I had the opportunity to schedule an interview with you where I can tell you more about my strenghts and experiences.
Projects
1 - Keyword Clustering (for Conde Nast)
a clustering tool using NLP, Python, GCP to reduce approximately 10 million keywords into a manageable number of topic clusters. Visualization was made with Looker (earlier DataStudio). The script is "under construction" and yet to be made public.
2 - Quotes for your Posts
an API using datasets of images and quotes to find the closest matching
quotes to the images (using Deep Learning and Machine Learning models).
We were a team of 4 Data Science students with me as team lead that worked on this project within a time period of 2 weeks. My 10-minute long presentation can be found here and the repo here.
3 - Prestweets
A project to visualize how often, how objective and how positive/negative different heads of states are tweeting. Tried out various NLP models to show the likelihood of a new tweet being from a certain Head of State. Data Source: Twitter, using snsscrape. Type of analysis: Sentiment analysis of tweets for objectivity and negativity of tweets using TextBlob. To see the repo, click here.
4 - Olist exploratory data analysis
Data exploration of db containing 100.000 orders from the Brazilian eccomerce business Olist. Dataset was sourced from kaggle . Packages used: numpy, pandas, matplotlib. Repo can be accessed here.
5 - Django website for the Bayerisch-Ungarisches Forum e.V.
As I am Board Member for Youth Engagement, Online Presence and - Communication of the Bayerisch-Ungarisches Forum association and I have been given the opportunity to redesign their website and newsletter as they needed a "fresher" look to attract younger Bavarians and Hungarians living in Bavaria to join the association while also ensuring it remains easily usable for the elderly. You can visit their website here.
Work experience & education
(in chronocogical order)

Data Scientist in Audience Innovation
Condé Nast Germany GmbH (Munich) | 2022 - 2023
development of a clustering tool (NLP, Python, GCP) to reduce approximately 10 million keywords into a manageable number of topic clusters; visualization of clustering results using Looker and DataStudio; continuous optimization of the clustering tool using Dask, Pickles, and VM optimization; creation and management of various GCP VMs; further development and optimization of a recommendation tool created by the Audience Innovation Team for thematic inspiration of editors; conducting data imports and exports using BigQuery, Databricks, and Mode; efficient data archiving on GCP; extensive research on NLP and memory optimization; supporting the Audience Innovation Team on data science-related questions
Data Science Teaching Assistant
Le Wagon (Munich) | 2022 - (part-time)
Basic Python & SQL, Statistics, Probability, Linear Algebra, Statistical inferences, Machine Learning
Data Science Bootcamp - Student
Le Wagon (Munich) | 2022
Basic Python & SQL, Data Analysis, Decision Science, Communication, Machine Learning, Deep Learning, Data Engineering
Credit & Collection Specialist
Getty Images Deutschland GmbH (Munich) | 2019–2021
German Withholding Tax project (reconciliations, finding external and internal WHT
solutions (resolution for more than 5 million euros of WHT) - mainly working with Microsoft Excel and Salesforce; solutions for the German VAT rate change due to Covid; participating in projects of reducing costs
Junior Revenue Cycle Analyst
Paramount Pictures Germany GmbH (Munich) | 2017–2019
development projects to improve daily processes within the Finance Team - mainly working with Microsoft Excel and SAP; cash application functions for PPG; reconciliation of clients’ accounts; invoicing
Temporary Revenue Cycle Analyst
Paramount International Home Media Distribution Group /Viacom International Hungary Kft. (Budapest) | 2016 - 2017
reconciling Netflix’s and Amazon’s accounts; adhoc reconciliation projects for big client groups - mainly working with Microsoft Excel; documenting processes handled within the division and training new employee; researching client and internal queries which can require coordination with various divisions
Internship
Hungarian Research Institute of Canada (Toronto) | 2015
Internship
Collegium Hungaricum Berlin | 2015
BA in Politics and Public Administration
University of Konstanz | 2013 - 2016
Strong focus on Statistics/Mathematics and Political Analytics
Contact
Elements
Text
This is bold and this is strong. This is italic and this is emphasized.
This is superscript text and this is subscript text.
This is underlined and this is code: for (;;) { ... }. Finally, this is a link.
Heading Level 2
Heading Level 3
Heading Level 4
Heading Level 5
Heading Level 6
Blockquote
Fringilla nisl. Donec accumsan interdum nisi, quis tincidunt felis sagittis eget tempus euismod. Vestibulum ante ipsum primis in faucibus vestibulum. Blandit adipiscing eu felis iaculis volutpat ac adipiscing accumsan faucibus. Vestibulum ante ipsum primis in faucibus lorem ipsum dolor sit amet nullam adipiscing eu felis.
Preformatted
i = 0;

while (!deck.isInOrder()) {
    print 'Iteration ' + i;
    deck.shuffle();
    i++;
}

print 'It took ' + i + ' iterations to sort the deck.';
Lists
Unordered
- Dolor pulvinar etiam.
- Sagittis adipiscing.
- Felis enim feugiat.
Alternate
- Dolor pulvinar etiam.
- Sagittis adipiscing.
- Felis enim feugiat.
Ordered
- Dolor pulvinar etiam.
- Etiam vel felis viverra.
- Felis enim feugiat.
- Dolor pulvinar etiam.
- Etiam vel felis lorem.
- Felis enim et feugiat.
Icons
Actions
Table
Default
| Name |
Description |
Price |
| Item One |
Ante turpis integer aliquet porttitor. |
29.99 |
| Item Two |
Vis ac commodo adipiscing arcu aliquet. |
19.99 |
| Item Three |
Morbi faucibus arcu accumsan lorem. |
29.99 |
| Item Four |
Vitae integer tempus condimentum. |
19.99 |
| Item Five |
Ante turpis integer aliquet porttitor. |
29.99 |
|
100.00 |
Alternate
| Name |
Description |
Price |
| Item One |
Ante turpis integer aliquet porttitor. |
29.99 |
| Item Two |
Vis ac commodo adipiscing arcu aliquet. |
19.99 |
| Item Three |
Morbi faucibus arcu accumsan lorem. |
29.99 |
| Item Four |
Vitae integer tempus condimentum. |
19.99 |
| Item Five |
Ante turpis integer aliquet porttitor. |
29.99 |
|
100.00 |